Average Rent in Fremont, CA
11 apartment buildings, 94 units. Real asking prices, refreshed daily.
Avg Rent
$3,675/mo
market average
Cheapest
$2,299/mo
Fremont Manor
Properties
11
tracked daily
Units
94
available now
Fremont, CA Resident Access
City Club members share insider gate codes, parking links, and amenity tips.
Analysis
Rent Price Breakdown
Compare pricing across all 11 properties in Fremont, CA.
Average Rent by Property
Starting Price vs Average
Rent by Bedroom Count
Price per Square Foot
Fremont, CA Rent Prices
All 11 properties ranked by lowest available rent.
Fremont Manor
4261 Stevenson Blvd, Fremont, CA 94538, USA
Fremont Arms Apartments
37811 Fremont Blvd, Fremont, CA 94536, USA
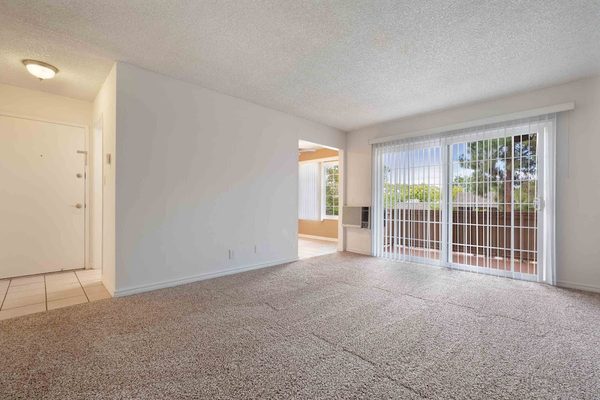
The Edge on the Boulevard
34500 Fremont Blvd, Fremont, CA 94555, USA
Amber Court
34050 Westchester Terrace, Fremont, CA 94555, USA
Pasatiempo
39548 Fremont Blvd, Fremont, CA 94538, USA
Vue Fremont
37200 Paseo Padre Pkwy, Fremont, CA 94536, USA
Koda on Fremont
39867 Fremont Blvd, Fremont, CA 94538, USA
| # | Property | From | Avg | $/sqft | Rating | Units |
|---|---|---|---|---|---|---|
| 1 | Fremont Manor 4261 Stevenson Blvd, Fremont, CA 94538, USA | $2,299 | $2,509 | $2.89 | 4.7 (28) | 2 |
| 2 | Fremont Arms Apartments 37811 Fremont Blvd, Fremont, CA 94536, USA | $2,350 | $2,510 | $3.67 | 4.3 (58) | 5 |
| 3 | The Edge on the Boulevard 34500 Fremont Blvd, Fremont, CA 94555, USA | $2,350 | $2,400 | $3.79 | 3.9 (22) | 2 |
| 4 | Amber Court 34050 Westchester Terrace, Fremont, CA 94555, USA | $2,628 | $2,819 | $3.78 | 4.1 (77) | 3 |
| 5 | Pasatiempo 39548 Fremont Blvd, Fremont, CA 94538, USA | $2,694 | $2,694 | $4.99 | 4.5 (22) | 2 |
| 6 | Vue Fremont 37200 Paseo Padre Pkwy, Fremont, CA 94536, USA | $2,711 | $3,066 | $4.28 | 4.2 (63) | 3 |
| 7 | Koda on Fremont 39867 Fremont Blvd, Fremont, CA 94538, USA | $2,869 | $3,072 | $3.05 | 4.3 (106) | 6 |
Explore Each Property
Fremont Manor
4.7 (28)4261 Stevenson Blvd, Fremont, CA 94538, USA
Fremont Arms Apartments
4.3 (58)37811 Fremont Blvd, Fremont, CA 94536, USA
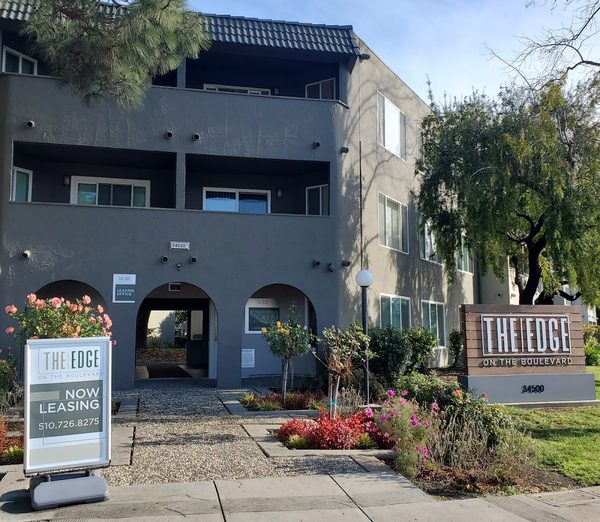
The Edge on the Boulevard
3.9 (22)34500 Fremont Blvd, Fremont, CA 94555, USA
Amber Court
4.1 (77)34050 Westchester Terrace, Fremont, CA 94555, USA
Pasatiempo
4.5 (22)39548 Fremont Blvd, Fremont, CA 94538, USA
Vue Fremont
4.2 (63)37200 Paseo Padre Pkwy, Fremont, CA 94536, USA
Fremont, CA Average Rent Prices 2026
The average rent in Fremont, CA is $3,675 per month, based on 94 units across 11 apartment communities. Prices range from $2,299 at Fremont Manor to $3,376 at The Asher.
Average Rent by Bedroom Type
| Type | Avg Rent | Starting From | Units |
|---|---|---|---|
| 1 Bed | $3,149/mo | $2,299/mo | 37 |
| 2 Bed | $3,881/mo | $2,699/mo | 50 |
| 3 Bed | $4,988/mo | $4,001/mo | 7 |
Every price is a real asking rent, updated that morning. Request a neighborhood we don't cover and we add it within 24 hours.
Building Economics
How much do Fremont, CA apartments earn?
The 9 buildings we can estimate generate about $5.0M in rental revenue per month ($60M a year). Estimated from each building's unit-level listing and leasing activity.
| Building | Est. Monthly Revenue | Est. Occupancy | Units |
|---|---|---|---|
| 1.The Asher | $2.2M/mo | 93% | 632 |
| 2.Avalon Fremont | $866K/mo | 93% | 238 |
| 3.Archstone Fremont Center Apartments | $484K/mo | 95% | 144 |
| 4.Vue Fremont | $412K/mo | 98% | 137 |
| 5.Artist Walk Apartments | $357K/mo | 94% | 102 |
Research estimates from listing activity, not operator financials. Click any building for the full revenue breakdown and methodology.
Market Context
Who rents in Fremont, CA, and what they pay
Tracked one-bedroom rent in Fremont, CA averages $3,149/mo, with two-bedroom units averaging $3,881/mo. At the local median household income of $176,350, that works out to 25% of gross income, well within the 25 percent comfortable-rent threshold.
The U.S. Census Bureau's American Community Survey 2023 release pegged median gross rent in Fremont, CA at $2,905/mo. The current tracked market average runs 27% higher than that benchmark, reflecting both two to three years of rent growth and the fact that the Census figure covers all renter-occupied housing in Fremont, CA while the tracked market average covers units currently listed in larger apartment communities.
Who employs renters in Silicon Valley
Demand in the Silicon Valley rental market is shaped by the metro's largest private and public employers. The following organizations anchor local hiring and influence what renters can pay:
- Tesla
- Lam Research
- Seagate Technology
- Western Digital
Mean one-way commute in Fremont, CA is 31 minutes, per the Census ACS, useful context when weighing which properties sit inside reasonable reach of these employers.
What salary do I need to live comfortably in Fremont, CA?
Built on the 25 to 30 percent rent-to-income guideline used by most landlords and credit-scoring models.
Minimum to afford average rent
$147,000/year
Based on the 30 percent rule, using our tracked average rent of $3,675/mo.
Comfortable income
$176,000/year
Based on the 25 percent rule, leaving more room for savings, transport, and groceries.
To afford the cheapest tracked apartment ($2,299/mo), you need to earn at least $92,000/year.
Median household income in Fremont, CA is $176,350 , about 0% above the comfortable-living threshold.
Cost of living in Fremont, CA
Overall prices in Fremont, CA runs above the national average by about 18% (BEA Regional Price Parity index 117.6, where 100 equals the U.S. average). The breakdown below estimates monthly costs for a single adult, using national consumer-spending baselines from the Bureau of Labor Statistics scaled by Fremont, CA's regional price parities.
| Category | Monthly estimate |
|---|---|
| Rent (market average) | $3,675 |
| Utilities | $861 |
| Groceries | $622 |
| Transportation | $2,051 |
| Healthcare | $1,001 |
| Other goods and services | $1,601 |
| Estimated total | $9,811/mo |
Population
228,518
Median household income
$176,350
Census median rent
$2,905/mo
Rent as % of income
27.0%
Median age
38.8
Mean commute
31 min
Methodology
Rent data
Sourced directly from each tracked apartment community and refreshed every 24 hours. Every listed unit price on this page is real and listed today.
Cost of living
Estimates combine national consumer-spending baselines from the U.S. Bureau of Labor Statistics (Consumer Expenditure Survey) with the U.S. Bureau of Economic Analysis Regional Price Parities (MARPP dataset). Both are peer-reviewed federal data releases published annually.
Salary to live comfortably
Applies the standard 25 to 30 percent rent-to-income rule on top of the listed rent. This is the same affordability guideline used by most landlords and credit-scoring models.
Demographic figures
Median household income, population, median age, commute time, Census median rent, and rent as percentage of income come from the U.S. Census Bureau's American Community Survey 5-year estimates, the most recent complete release.
Cost of living and demographic figures were last published in 2023.
Compare
Nearby cities in California
How Fremont, CA rent compares to other markets in the state.
| City | Avg Rent | vs Fremont, CA | Properties |
|---|---|---|---|
| Los Angeles, CA | $2,974 | -19% | 42 |
| Anaheim, CA | $2,865 | -22% | 32 |
| San Diego, CA | $3,166 | -14% | 26 |
| Riverside, CA | $2,560 | -30% | 25 |
| Sacramento, CA | $2,360 | -36% | 24 |
| Oakland, CA | $3,577 | -3% | 20 |
Frequently asked questions
What is the average rent in Fremont, CA?
The average rent in Fremont, CA is $3,675 per month, based on 94 units across 11 apartment buildings tracked by Average Rent. Prices are refreshed daily.
What is the cheapest apartment rent in Fremont, CA?
The lowest available rent in Fremont, CA starts at $2,299 per month. Availability changes daily and prices are refreshed each morning.
How much is a 1-bedroom apartment in Fremont, CA?
1-bedroom apartments in Fremont, CA average $3,149/mo. The lowest listed 1-bedroom starts at $2,299/mo across 37 units tracked.
How much is a 2-bedroom apartment in Fremont, CA?
2-bedroom apartments in Fremont, CA average $3,881/mo. Units start from $2,699/mo across 50 units currently listed.
Rent Trends in Fremont, CA
Track how apartment prices are changing over time.
Missing your neighborhood?
Tell us where you're looking. We'll start tracking prices within 24 hours.
Get Started